TL;DR: Google Search Console tells you what Google wants you to see. Server logs tell you what Googlebot actually did. I found that Googlebot was spending 73% of its crawl budget on parameter URLs we’d forgotten existed. GSC showed nothing wrong. Here’s how to set up log file analysis, what to look for, and why this is the most underused technique in technical SEO.
Google Search Console is a fantastic tool. I use it daily. But it has a fundamental problem: it only shows you what Google has chosen to report.
GSC’s crawl stats tell you aggregate numbers — total requests, average response time, some status codes. What it doesn’t tell you is which specific URLs Googlebot hit, in what order, how long each request took, whether Googlebot came back for a second pass to render JavaScript, or which sections of your site it’s ignoring entirely.
That’s the gap. And it’s a massive one.
Server logs are the unfiltered truth. Every request Googlebot makes to your server gets logged with a timestamp, the exact URL, the status code, the response time, and the user agent string. No summarization, no sampling, no Google deciding what you need to know. Raw data.
I’ll be honest about something: I ignored log file analysis for the first two years of running SEOJuice. It felt like something enterprise SEOs did with six-figure Botify contracts. I was wrong. The moment I started parsing our own Nginx logs, I found problems that GSC had been hiding for months. Crawl budget waste on faceted URLs. 5xx errors that only happened under Googlebot’s crawl patterns. New blog posts that Googlebot hadn’t visited in three weeks.
Based on what I’ve seen across hundreds of sites: in my experience, nearly every site with more than 500 pages has at least one significant crawl issue that only log analysis can reveal.
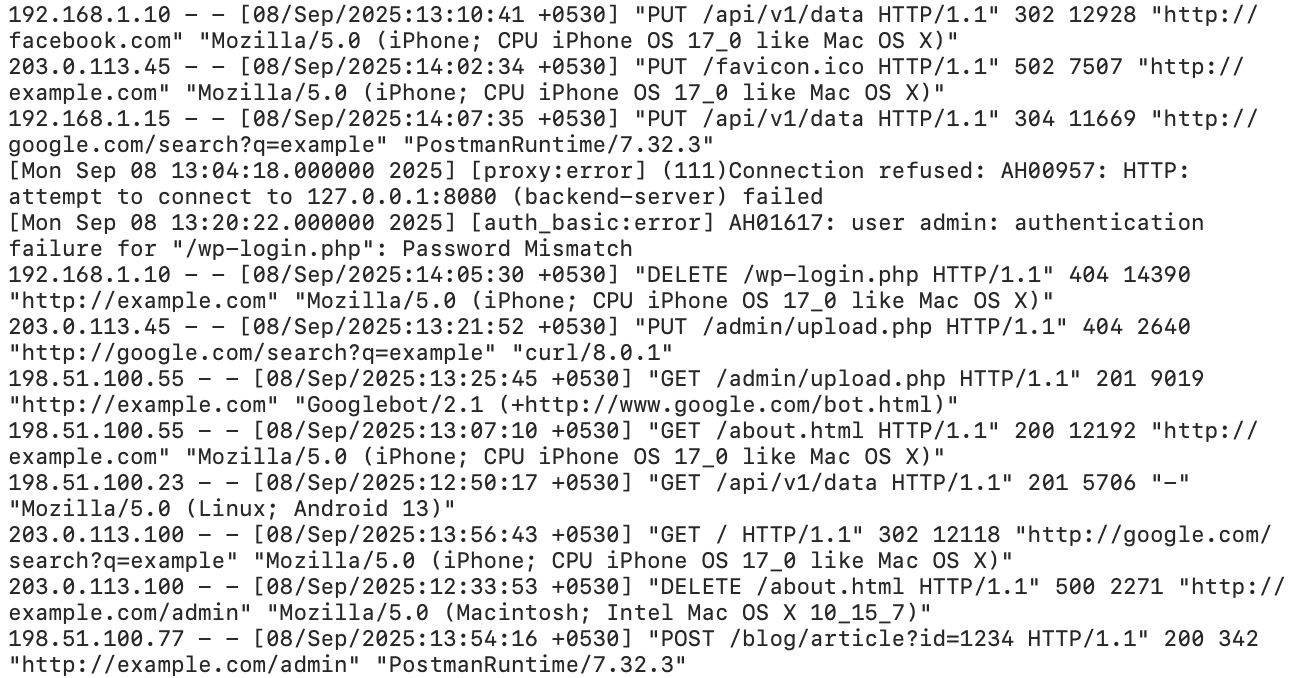
Let me break that apart:
| Field | Value | What It Means |
|---|---|---|
| IP Address | 66.249.79.45 | Googlebot’s IP (66.249.x.x range is Google) |
| Timestamp | [15/Mar/2026:09:23:17 +0000] | Exact time of the request |
| Request | GET /blog/content-decay-guide/ HTTP/2.0 | Which URL was crawled |
| Status Code | 200 | Server response (200 = OK) |
| Bytes Sent | 34521 | Response size in bytes |
| Referer | - | Where the request came from (usually empty for bots) |
| User Agent | Googlebot/2.1 | Identifies the crawler |
| Response Time | 0.142 | 142ms to serve the page |
Different web servers use slightly different formats. Apache’s “Combined Log Format” is almost identical to Nginx’s. IIS uses a W3C extended format with space-separated fields and a header line defining columns. The data is the same — the arrangement differs.
The critical fields for SEO are: user agent (to filter for bots), URL (to see what’s being crawled), status code (to find errors), and response time (to find performance bottlenecks).
Not every Googlebot request is the same crawler. Google uses different user agents for different purposes, and distinguishing them matters.
| User Agent String | What It Does | Why It Matters |
|---|---|---|
Googlebot/2.1 | Primary web crawler | This is the main crawl — your core pages |
Googlebot-Image/1.0 | Image crawler | Crawls images for Google Images index |
Googlebot-Video/1.0 | Video crawler | Discovers and indexes video content |
Googlebot-News | News crawler | Only relevant if you’re in Google News |
APIs-Google | AMP/API fetcher | Fetches AMP pages and special content |
Chrome/W.X.Y.Z (with Googlebot) | Rendering bot | This is the big one. When you see a Chrome UA alongside Googlebot, that’s the Web Rendering Service — Google executing your JavaScript |
The rendering bot is especially important. When Googlebot first crawls a page, it gets the raw HTML. If the page has JavaScript, Google queues a second request through its Web Rendering Service (WRS), which uses a headless Chrome browser. That second request shows up in your logs with a Chrome user agent string.
If you see the initial Googlebot hit but never the Chrome rendering pass on a JS-heavy page, Google is probably not seeing your full content. That’s invisible in GSC. Only log analysis reveals it.
Most default Nginx and Apache configs log enough data for basic analysis. But “basic” isn’t good enough. You want response time, and most defaults don’t include it.
Here’s the Nginx log format I use. Add this to your http block in nginx.conf:
log_format seo_analysis '$remote_addr - $remote_user [$time_local] '
                        '"$request" $status $body_bytes_sent '
                        '"$http_referer" "$http_user_agent" '
                        '$request_time $upstream_response_time';

access_log /var/log/nginx/access.log seo_analysis;
The two additions that matter: $request_time (total time from request to response) and $upstream_response_time (how long your application server took, excluding Nginx overhead). The difference between these two numbers tells you if the bottleneck is your app or your proxy layer.
For Apache, add %D (request time in microseconds) to your LogFormat directive:
LogFormat "%h %l %u %t \"%r\" %>s %b \"%{Referer}i\" \"%{User-Agent}i\" %D" seo_combined
CustomLog /var/log/apache2/access.log seo_combinedHere’s where it gets annoying. If you’re behind Cloudflare, Bunny CDN, Fastly, or any other CDN, your origin server logs only show requests that make it past the cache. A perfectly cached page might get crawled by Googlebot 50 times, and your origin sees zero of those requests.
You need CDN-level logs:
If your CDN doesn’t offer bot-level logging on your plan, you can set a rule to bypass cache for known bot user agents. This forces bot requests to hit your origin, where you can log them. The tradeoff is slightly higher origin load during crawls.
I’m not entirely sure this is worth the tradeoff for smaller sites. If you’re getting 200 Googlebot requests per day, the origin load from bypassing cache is negligible. If you’re getting 200,000, think carefully about your infrastructure before flipping that switch.
Logs get big fast. A site with 10,000 daily visits generates roughly 2-5 MB of access logs per day. Over a year, that’s 700 MB to 1.8 GB uncompressed. Gzipped, maybe 50-100 MB.
For SEO analysis, you want at minimum 90 days of logs. Ideally 6 months, so you can see seasonal crawl patterns and correlate with algorithm updates. Set up logrotate (Linux) or a cron job to compress and archive logs weekly. Delete anything older than 6 months unless you have a specific reason to keep it.
I want to dedicate this to the late Hamlet Batista, who pioneered the use of Python for SEO log analysis and automation. Hamlet passed away in 2020, but his work — particularly his writing on using Python and Jupyter notebooks for technical SEO — fundamentally changed how our industry approaches data problems. Much of what follows builds on patterns he taught the SEO community.
Here’s a basic Python script that filters Nginx logs for Googlebot requests and generates the metrics that actually matter for SEO. This is close to what I ran against SEOJuice.com’s own logs.
import re
import csv
from collections import Counter, defaultdict
from datetime import datetime

LOG_PATTERN = re.compile(
    r'(?P<ip>\S+) \S+ \S+ '
    r'\[(?P<timestamp>[^\]]+)\] '
    r'"(?P<method>\S+) (?P<url>\S+) \S+" '
    r'(?P<status>\d{3}) (?P<size>\d+) '
    r'"[^"]*" "(?P<ua>[^"]*)" '
    r'(?P<response_time>[\d.]+)?'
)

GOOGLEBOT_PATTERN = re.compile(r'Googlebot|Google-InspectionTool', re.IGNORECASE)

def parse_log(filepath):
    """Parse Nginx log, return only Googlebot requests."""
    results = []
    with open(filepath, 'r') as f:
        for line in f:
            match = LOG_PATTERN.match(line)
            if not match:
                continue
            if not GOOGLEBOT_PATTERN.search(match.group('ua')):
                continue
            results.append({
                'ip': match.group('ip'),
                'timestamp': match.group('timestamp'),
                'url': match.group('url'),
                'status': int(match.group('status')),
                'size': int(match.group('size')),
                'ua': match.group('ua'),
                'response_time': float(match.group('response_time') or 0),
            })
    return results

def analyze(requests):
    """Generate SEO-relevant metrics from Googlebot requests."""
    url_counts = Counter(r['url'] for r in requests)
    status_counts = Counter(r['status'] for r in requests)
    slow_urls = [
        (r['url'], r['response_time'])
        for r in requests if r['response_time'] > 1.0
    ]

    # Section-level crawl distribution
    section_counts = Counter()
    for r in requests:
        parts = r['url'].strip('/').split('/')
        section = parts[0] if parts and parts[0] else '(root)'
        section_counts[section] += 1

    print(f"Total Googlebot requests: {len(requests)}")
    print(f"\n--- Status Code Distribution ---")
    for code, count in status_counts.most_common():
        pct = (count / len(requests)) * 100
        print(f"  {code}: {count} ({pct:.1f}%)")

    print(f"\n--- Top 20 Most Crawled URLs ---")
    for url, count in url_counts.most_common(20):
        print(f"  {count:>5}x  {url}")

    print(f"\n--- Crawl Distribution by Section ---")
    total = len(requests)
    for section, count in section_counts.most_common(10):
        pct = (count / total) * 100
        print(f"  /{section}/: {count} ({pct:.1f}%)")

    print(f"\n--- Slow Responses (>1s) ---")
    for url, time in sorted(slow_urls, key=lambda x: -x[1])[:10]:
        print(f"  {time:.2f}s  {url}")

if __name__ == '__main__':
    requests = parse_log('/var/log/nginx/access.log')
    analyze(requests)
That’s maybe 60 lines of code. It took me 20 minutes to write. And the output immediately showed me that Googlebot was hammering our /tools/ section (73% of all crawl requests) while barely touching new blog posts. Which explained why our new content wasn’t getting indexed for weeks.
For larger sites or ongoing monitoring, you’ll want something more robust. The ELK stack (Elasticsearch, Logstash, Kibana) is the industry standard for log aggregation at scale. Logstash ingests and parses the logs, Elasticsearch indexes them for fast queries, and Kibana gives you dashboards. It’s powerful but not trivial to set up — budget a day or two for the initial configuration.

The /tools/ section had dozens of parameter combinations (filters, sort options, pagination) generating thousands of crawlable URLs. Googlebot was dutifully crawling all of them. Meanwhile, our blog — the section that actually drives organic traffic — was getting 11% of crawl attention.
The fix was a combination of canonical tags, robots.txt rules, and noindex on parameter variants. We also restructured internal linking to better reflect our content silos. Within two weeks, blog crawl frequency doubled. New posts started getting indexed within days instead of weeks.
You can’t see this in GSC. GSC gives you total crawl requests. It doesn’t break them down by section or show you the distribution problem.
Aggregate your status codes across all Googlebot requests. Here’s what healthy looks like:
I once saw a site where 22% of Googlebot requests were returning 404. The previous developer had deleted a product category without redirecting. Googlebot had those URLs in its crawl queue and kept retrying them. Twenty-two percent of crawl budget, burned on pages that didn’t exist. For eight months.
Google has stated repeatedly that page speed is a ranking factor. But Core Web Vitals (which GSC reports) measure client-side performance. Server response time — how long your server takes to generate and send the HTML — is a different thing, and it only shows up in logs.
What you’re looking for: any URL where the response time exceeds 500ms consistently. Over 1 second is a problem. Over 2 seconds and Googlebot may abandon the request entirely.
Sort your Googlebot requests by response time, descending. The slowest URLs usually fall into a few categories: database-heavy pages (product listings with complex filters), pages that make external API calls during rendering, or pages that generate large responses (sitemaps, feeds).
How many clicks from the homepage does Googlebot need to reach a page? This isn’t directly in the log data, but you can infer it by looking at timestamps and referral patterns.
If Googlebot hits your homepage at 09:00, your main category pages at 09:01, and a deep product page at 09:14 — that 14-minute gap suggests the page is deeply nested. Pages that Googlebot discovers late in a crawl session get less attention.
A simpler approach: compare the set of URLs Googlebot crawled against your full sitemap. Any URL in the sitemap that Googlebot hasn’t visited in 30+ days is effectively orphaned from Google’s perspective, regardless of what your internal linking says.
This is a security and performance metric as much as an SEO one. Filter your logs by user agent and calculate what percentage of total requests come from bots versus real users.
On most sites, bots account for 30-50% of all requests. If bots account for 80%+, you’re probably getting scraped or hit by bad bots that are wasting server resources. If Googlebot specifically represents less than 5% of your bot traffic, something else is consuming your server capacity and potentially slowing down Google’s ability to crawl you.
This might be the most valuable analysis you can do. Take the list of URLs in your sitemap or CMS. Compare it against the list of URLs Googlebot has visited in the last 90 days. Any URL that Googlebot hasn’t touched is functionally invisible.
Common causes: the page has no internal links pointing to it (a true orphan page), the page is too deep in the site architecture, or the page is blocked by a robots.txt rule you forgot about.
I’m genuinely not sure why more SEOs don’t do this analysis routinely. It takes 10 minutes with the Python script above and a list of your URLs. Every time I’ve run it for a client, we’ve found pages that were supposed to be important but hadn’t been crawled in months.
Theory is nice. Here are the actual problems I’ve found through log analysis, on real sites, that would have gone undetected otherwise.
Already mentioned our own experience. But it’s worth emphasizing: faceted navigation, search parameters, sort orders, and pagination create an exponential number of crawlable URLs. A product catalog with 500 products, 8 filter categories, and 3 sort options can generate tens of thousands of URLs. Googlebot will try to crawl all of them.
According to Botify’s published crawl budget research (2023), on large e-commerce sites, up to 80% of Googlebot’s crawl budget can be consumed by parameter URLs that deliver near-identical content — though the exact figure varies significantly by site type and architecture. Their CTO, Adrien Menard, has written extensively about this: the crawl budget problem on large sites isn’t about getting Google to crawl more — it’s about stopping Google from wasting crawls on low-value URLs.
One client had intermittent 503 errors that only appeared during Googlebot’s crawl bursts. Their monitoring (Pingdom, UptimeRobot) showed 99.9% uptime because those tools check once per minute from a single location. Googlebot hits 10-50 pages in rapid succession. Their server couldn’t handle the burst, threw 503s for about 15% of Googlebot requests, and recovered within seconds.
GSC’s crawl stats showed a slightly elevated error rate. The logs showed the full picture: every day between 2 AM and 3 AM UTC (when Googlebot tends to hit this particular site), the server was failing under load. Fixing it required tuning PHP-FPM worker counts and database connection pooling. Total cost: two hours of DevOps work. The ranking improvements showed up within three weeks.
We published a detailed guide. Three weeks later, it still wasn’t indexed. GSC showed the URL as “Discovered — currently not indexed.” Helpful.
Logs told the real story: Googlebot had never requested the URL. Not once. The page was linked from a tag archive page that itself had been crawled only twice in 60 days. Googlebot simply hadn’t followed the link yet.
The fix was adding an internal link from a frequently crawled page (our homepage sidebar). Googlebot hit the new page within 48 hours. Indexed within a week. This is exactly the kind of issue a post-launch SEO checklist should catch before it becomes a problem.
A SaaS client had a marketing site built in Next.js. SSR was enabled — good. But the logs showed something strange: Googlebot’s Chrome rendering bot was making a second pass on every single page, including simple static pages that had no client-side dynamic content.
The problem was a client-side analytics script that modified the DOM after page load. Googlebot saw the initial HTML, then came back to render JS and saw different content (the analytics-injected elements). So it kept re-rendering to make sure it had the final version. This was consuming rendering budget on pages that didn’t need it.
The fix: move the analytics script to load after the DOMContentLoaded event with a defer attribute, and ensure it didn’t modify visible DOM elements. Rendering requests dropped by 60%.

Botify — Enterprise-grade. Ingests logs at scale, correlates with crawl data and Search Console, and builds dashboards automatically. If you manage a site with millions of pages, this is probably worth the investment. For sites under 100k pages, it’s overkill. Pricing was in the hundreds-per-month range last I checked (as of mid-2025), though their exact pricing is opaque and I have mixed feelings about that.
JetOctopus — A strong middle ground. Cloud-based log analysis with good visualization. Handles large log files, integrates with GSC, and costs significantly less than Botify. I’ve recommended this to agencies managing multiple mid-size sites.
Custom Python + ELK — If you’re technical and want full control, the script above is a starting point. For ongoing monitoring, pipe your logs into the ELK stack (Elasticsearch, Logstash, Kibana). Logstash parses the logs with grok patterns, Elasticsearch stores and indexes them, Kibana gives you real-time dashboards. Setup takes a day. Ongoing cost is just the server — maybe $20-$50/month on a small VPS.
GoAccess — A lightweight, terminal-based log analyzer that generates HTML reports. Not SEO-specific, but surprisingly useful for a quick overview of bot activity and status code distribution. Free, fast, works on any server. Good for the “I just want to check something quickly” use case.
Transparency moment. Here’s what I found when I first ran a proper log analysis on our own site in late 2025.
Finding 1: Crawl budget waste on tool pages. Our free SEO tools (site audit, domain authority checker, keyword extractor, etc.) generate unique URLs per analysis. Each tool result had a unique URL. Googlebot was crawling thousands of them. These were mostly thin, ephemeral pages that didn’t need to be in the index. We added noindex to tool result pages and saw our blog crawl rate increase within two weeks.
Finding 2: Slow API-dependent pages. Our pricing page made a real-time call to Paddle’s API to fetch current prices. Median response time: 1.8 seconds. Googlebot was waiting for it. We switched to caching the pricing data with a 1-hour TTL. Response time dropped to 90ms.
Finding 3: 301 redirect chains. After a URL restructuring, we had chains like /old-url → /medium-url → /final-url. Twelve percent of Googlebot’s requests were following redirects. Each hop is a wasted request. We flattened all chains to single-hop redirects in our Nginx config.
Finding 4: CSS and JS crawling. This surprised me. Roughly 30% of Googlebot’s requests were for static assets — CSS files, JavaScript bundles, fonts. These are necessary for rendering, but it meant only 70% of our crawl budget was going to actual content pages. We couldn’t eliminate this (Google needs these files to render pages), but it reframed how we thought about our total crawl budget.
Net result: after addressing findings 1-3, our blog content was getting indexed 3-4x faster. New posts went from “discovered but not indexed for 2-3 weeks” to “indexed within 3-5 days.” All from log analysis insights that GSC never surfaced.
I built the crawler analytics feature in SEOJuice specifically because I was tired of parsing raw logs. It gives you the same insights without the command-line work.
SEOJuice’s crawler analytics monitors Googlebot activity on your site and surfaces:
It doesn’t replace raw log analysis for every use case. If you need to debug a specific Nginx configuration or investigate IP-level bot behavior, you still need the raw logs. But for the 90% of cases where you just want to know “is Googlebot crawling the right stuff?” — it’s a lot faster than writing Python scripts.
Try SEOJuice free and connect your site to see crawler analytics in action. No credit card required.
You don’t need to stare at logs every day. Here’s the monthly routine I follow:
Total time: 30-45 minutes. The ROI is disproportionate.
I haven’t tested this exhaustively across every niche, but there’s no hard minimum — the payoff scales with site size. Under 100 pages, Googlebot will crawl everything regardless, and you’re unlikely to have crawl budget issues. Between 500-5,000 pages is where it starts becoming valuable. Above 10,000 pages, it’s essential — crawl budget waste is almost guaranteed on sites that large. That said, even a 200-page site can benefit if you’re seeing indexing delays or mysterious ranking drops.
Yes. Google publishes its IP ranges, and you can do a reverse DNS lookup on the requesting IP. Legitimate Googlebot IPs resolve to *.googlebot.com or *.google.com. In Python: import socket; socket.gethostbyaddr('66.249.79.45'). Any IP that doesn’t resolve to a Google domain is a fake Googlebot — likely a scraper using Googlebot’s user agent string. Google’s official documentation recommends this verification method.
It varies enormously. A high-authority news site might see thousands of Googlebot requests per hour. A small business site might see 50-200 per day. The frequency depends on your site’s perceived importance, how often your content changes, your server’s response speed, and your XML sitemap freshness. According to JetOctopus’s 2024 crawl frequency analysis across their customer base, the median crawl frequency for a 5,000-page site is roughly 300-800 Googlebot requests per day.
Block bad bots at the server level (Nginx deny rules or fail2ban), not just in robots.txt. Robots.txt is a suggestion — malicious bots ignore it. But be careful: don’t accidentally block legitimate crawlers. I’ve seen sites that blocked all bots with “bot” in the user agent string, which caught Googlebot. Always whitelist Google, Bing, and any other search engines you care about before implementing broad bot-blocking rules.
Log file analysis is how you measure crawl budget. Google defines crawl budget as the combination of crawl rate limit (how fast Google can crawl without overloading your server) and crawl demand (how much Google wants to crawl based on perceived value). You can’t directly control either, but you can influence them: faster response times increase crawl rate limit, and removing low-value pages from Google’s crawl queue increases the proportion of crawl budget spent on pages that matter. Logs show you both sides of this equation.
Log file analysis isn’t glamorous. It’s grep and regex and piping text files through scripts. There are no pretty dashboards (unless you build them). But it’s the closest you’ll get to seeing your site through Google’s eyes. GSC shows you a curated summary. Logs show you the raw truth.
If you’re managing a site with more than a few hundred pages and you’ve never looked at your server logs, you have crawl problems you don’t know about. I’d bet money on it.
Further reading in the Technical SEO silo:
no credit card required
